|
Hi Devender,
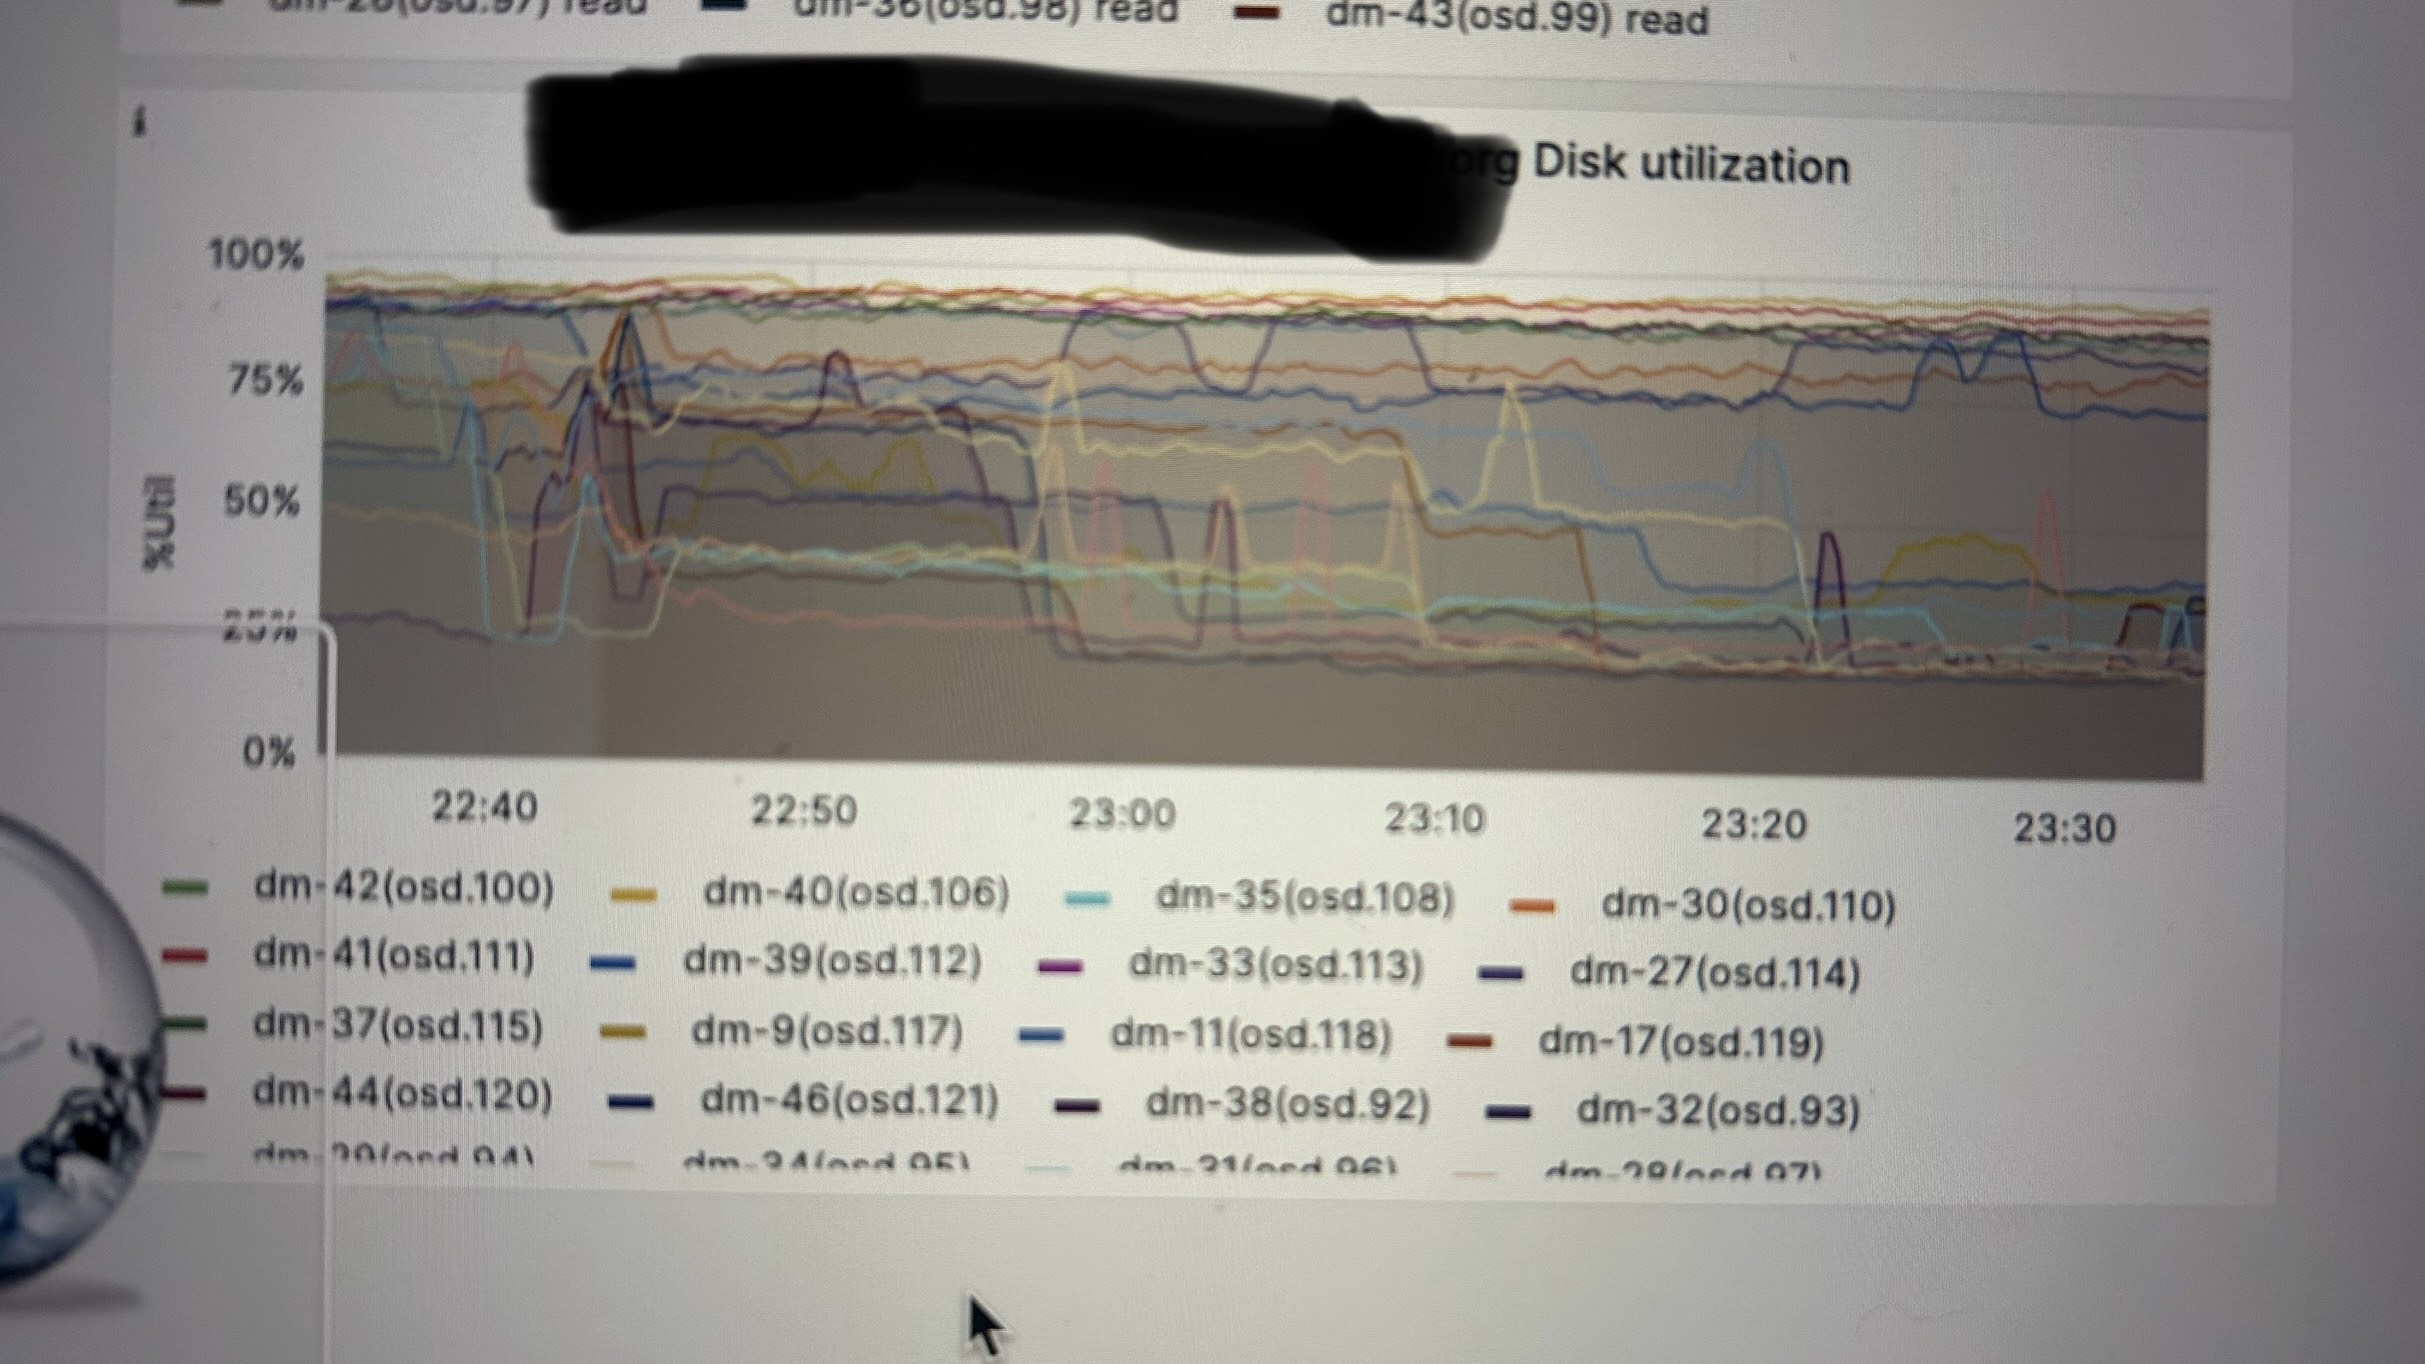
If I'm not wrong, that graph shows the disk utilization in terms of I/O, not the utilization in terms of capacity. Basically the value you get while doing iostat -x.
Best
-----------------------------------------------------------------
Roberto VALVERDE CAMESELLE
IT Storage And Data Management
CERN, European Organization for Nuclear Research
Esplanade des Particules 1, Geneve (Switzerland)
From: Devender Singh <devender@xxxxxxxxxx>
Sent: Wednesday, July 2, 2025 5:25 PM To: ceph-users <ceph-users@xxxxxxx> Subject: Disk Utilisation Graph Hello All
I need to understand what below graph expalining and which disk utilisation it is?
I have 8 NVME and 16 SSD and their weight is 1 with 20% disk utilised as per osd df.
If keeping the weight of NVME and reweight SSD to some .8 and .9 will worth anything to lower this graph utilisation?
Below is the graph under each host performance on CEPH dashboard.
 Regards
Dev
|
_______________________________________________
ceph-users mailing list -- ceph-users@xxxxxxx
To unsubscribe send an email to ceph-users-leave@xxxxxxx
